US adult employment as a fraction of all adults reached an all-time high of 66.3 percent in March 2000. Since then, there has been an accelerating downward trend, and the ratio has recently dropped below 61%, a level we have not seen in 25 years.
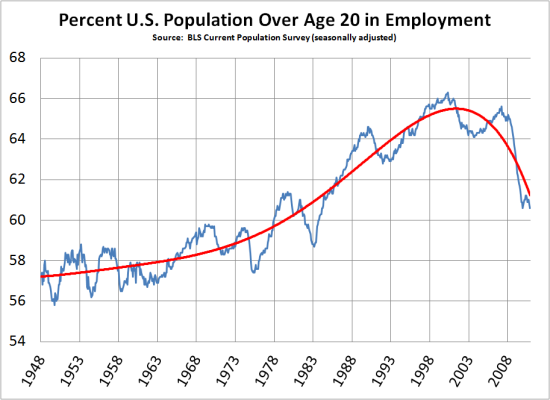
This ten-plus year decline was not caused by changing demographics. It started when the earliest baby boomers were just turning 55. Moreover, the fraction of those age 65+ who are employed increased from 12.7% in March 2000 to 16.3% in November 2010, according to the same BLS database. Our demographic crisis lies ahead, as seniors are projected to increase from 22% of the population today to 38% by 2030 (slide 6), and of course that will depress the employment to population ratio even more.
The causes were a bursting of the internet bubble initially but more profoundly the offshoring of jobs. The NASDAQ index closed at an all-time high of 5,048.62 on March 10, 2000. A year later, dot-com companies were shrinking and failing right and left, the NASDAQ index was below 2,000, and the US was officially in a recession. The employment-population ratio naturally declined as it has in every recession, but then it did not rebound as it always had in the past. Our trade deficit, only -1% in 1997, exploded to -6% by 2005—a 5% negative shift away from domestic production with domestic labor. To a first approximation, offshoring 5% of GDP eliminated about 5% of the 131 million jobs that existed at the end of 1997, say 6.6 million direct jobs plus perhaps millions more indirectly. (Automation also eliminates jobs, but we have had automation continuously since WWII and have managed until 2000 to have job growth despite that.) As the chart clearly shows, the creation of domestic jobs to replace offshored jobs fell behind population growth, and is accelerating in the wrong direction.
What are the implications?
Except for the very wealthy, employment (including self-employment) is by far everybody's most important source of income. Without employment, most of us would sooner or later become destitute.
Incomes from employment support not only employees but also, typically, family members and, inevitably, government through taxes. Unemployment, therefore, starves families and reduces government revenues at the very time that the demand for government safety net services is increasing.
Our economy is lagging far behind its potential. We know that at least 66% of US adults want to work because that's the fraction that was working a mere decade ago. Yet now only 61% are working. If we could wave a wand and restore the employment-population ratio to the 2000 level, something like 11 million more Americans would have jobs and incomes, and GDP would be 8% greater.
Full employment would eliminate some of our fiscal woes and greatly ameliorate others. For example, during the late 1990s, when employment and real wages were both rising modestly, the Social Security trust fund was getting healthier every year—if that trend had continued, we could be increasing benefits and/or reducing payroll taxes instead of wringing our hands about doing the opposite. State and local governments could have balanced budgets without tax rate increases. And so on. If real median wages were also rising, the American Dream could be resurrected.
A continuing decline in the employment-population ratio, especially if accompanied by continuing decline of average middle-class earnings, would be an unmitigated disaster for America. Every time a family, business, or government tightens its belt a notch, the economy shrinks until all the belts have to be tightened again and more jobs are eliminated—and belts are tightened again. Money becomes unavailable for retirement savings, education, culture, environmental protection, or anything else that is not an urgent necessity. Hope would disappear, and our political system could develop dangerous fissures.
And yet hardly anybody inside the DC Beltway talks about how to achieve economic growth and full employment, or even the desirability of doing so. Nobody proposes any policies that are different from what we've been doing in the previous post-war recessions, or from the normal-times policies of the GOP since the 1970s and both parties since 1992. Why the bipartisan passivity about this? Do they love us less than the Chinese Communist Party leadership loves its citizens?
 Skeptic