Whether the US economy has slipped into "recession," or will in 2008, is discussed everyday in the media. Well, here is the real news: For the middle class, the working class, and the poor, the recession started 7 years ago. And, as the following graph of real median family income also shows, the Golden Age of middle class economic growth ended in the Nixon Administration. Do we care? Should we?
(NOTE: This was originally posted December 24, 2007. I discovered that I had inadvertently included a chart of after-tax family income by quintile when I was discussing pre-tax incomes. In making the correction, I inadvertently deleted the original version, an endnote, and an update, and republished the corrected body with today's date.)
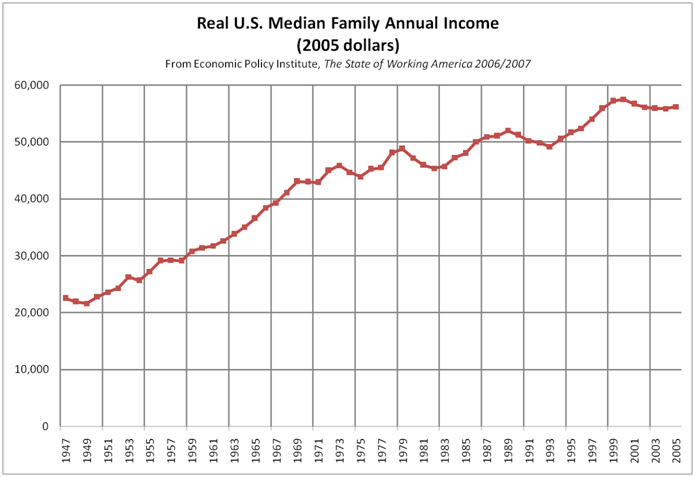
The Golden Age.
During the Golden Age from 1949 through 1973, inflation-adjusted (i.e., "real") median family income soared at a compound annual rate of 3.19%, from $21,597 to $45,865. Despite the fact that there were recessions that seemed significant at the time, median income rose every year except 1954 (down 2.41%), 1958 (down 0.45%), and 1970-71 (down 0.4% after two years). By the Rule of 72, real median income doubled in less than 23 years. The expectation that each new generation of Americans would do better economically was a central part of the American Dream.
The Crude Oil Shocks, Stagflation, Morning in America, and the Internet Bubble.
The Golden Age ended with the crude oil price shocks of 1973 and 1979, rampant inflation, and the period of stagflation and deep recession that bridged the Carter and Reagan Administrations, bottoming out in 1982. During this period, real median family income fell and rose twice but in 1983 was still below where it had been in 1973.
During the Reagan and first Bush Administrations, the real median income increased from $45,382 in the 1982 nadir to $52,015 in 1989, a compound annual rate of 1.97%, well below what it was during the Golden Age despite the stimulus of massive deficit spending. Then it declined again for 4 years straight, bottoming out at $49,169 in 1993. Thus, in the 11 Reagan/Bush years from the 1982 low to the 1993 low, the annual compound growth rate was only 0.73%. Not much of a "Morning in America" for the median family.
Running for re-election on this record, Bush lost to Clinton, who emphasized, "It's the economy, stupid." Despite reducing, and finally eliminating, deficit spending, the internet bubble (or something) drove real median family income from $49,169 in 1993 to an all-time high of $57,508 in 2000, a compound annual rate of 2.26%. I.e., growth during this upward-only interval was only 71% as robust as the entire 24-year Golden Age. Averaging out all of the volatility in the 27 years between the end of the Golden Age (1973) and the all-time high in 2000, the compound annual growth rate was only 0.84%. At that rate incomes would double in 86 years. And then it got worse.
The Current Middle Class Recession.
Real median income declined every year for 4 straight years under George W. Bush to $55,869 in 2004 and recovered only 0.58% to $56,194 in 2005. I could not find family income statistics for 2006, but the Census Bureau reports that real incomes for the third quintile of households rose about 1.2% that year, still below the ranges for 2000 and 2001. It is very likely that 2008 will be below 2007 and that both will be below 2000, especially if we go into a technical "recession" (defined as two consecutive quarters of declining GDP). What is meaningful to a median income family, everybody below the median, and millions of families somewhat above the median is that their real incomes have been down for 7 years and there's no foreseeable end to their declining economic status.
The Bigger—and Even Bleaker—Picture.
If real median income recovers in 2008 to the 2000 level, the compound annual growth rate from 1973 to 2008 will have been 0.65%, for a doubling time of 111 years. Hardly the stuff American Dreams are made of. But on an hourly basis, middle class families have not gained at all; they fell behind. Since the Golden Age, middle class families have been working much longer hours in order to increase median income only slightly. For example, husbands and wives age 25-54 with children together worked 18.1% more hours in 2004 than they did in 1973. The State of Working America 2006/2007, Table 1-24. (About 89% of the additional hours were worked by wives, confirming what we know intuitively—many more families have two earners than was the case in 1973.) During the same period real median income rose only 12.6%. They are attempting to climb a down-escalator and losing altitude.
Forget about GDP and Start Tracking Family Incomes.
If we want to understand how middle class, working class, and poor families fare in the economy, we should stop obsessing about GDP. The incomes of 80% of American families, and especially the bottom 60%, are no longer closely tied to changes in GDP, especially when GDP increases.
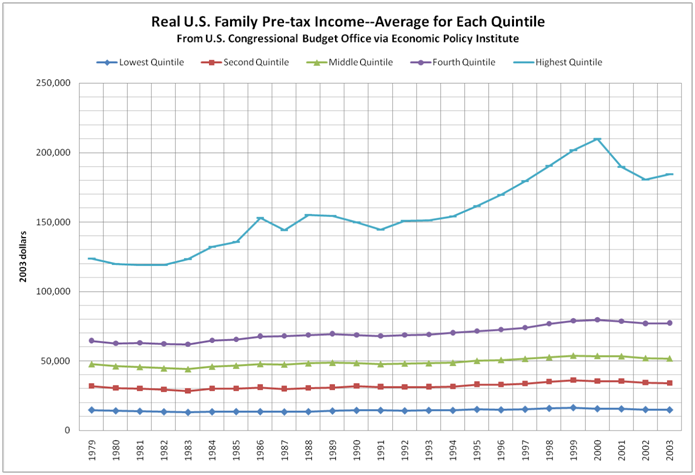
Note that the average income (in 2003 dollars) of the top quintile soared from $150,000 in 1992 to about $210,000 in 2000 and then fell back some during the Bush recession. Other data show that it was really the top 5% of families, and especially the top 1%, whose income changes most closely tracked changes in GDP. Real incomes for the bottom 3 quintiles essentially flat-lined for the entire 24-year period covered by this graph, and the fortunes of the 4th quintile were not much better.
And so . . . ?
Implicit in this history are many difficult questions as to which the answers are debatable and are certainly not technically or politically easy. For example: Why did the Golden Age end, and why has the subsequent history been so grim? Which uncontrollable exogenous forces and/or which domestic policy changes made the difference? What have been the effects of the declines of unions, minimum wage stagnation, the recovery of Europe and Japan from WWII, changing trade patterns, increasing globalization, technology changes, productivity changes, the shift from one-wage-earner to two-wage-earner families, asset valuation bubbles, lagging education, immigration, government regulations, exploding prices in certain sectors such as energy and health care, etc.? Why do increases in GDP no longer get shared by the lower strata? What government policies could make the economy work better for them? Which of those policy options would not unreasonably impair the returns to capital? But there is no need to get into such questions unless there is an important problem that government should address.
Well, is there a problem? Is this good enough for America? Or should it be a national goal to get the middle class moving again?
 Skeptic

